For a clear screenshot with consistent rows and columns, Local Image to Table is a useful starting point. For a complex table with multi-level headers, merged cells, wrapped descriptions, or irregular spacing, start with AI Image to Table when uploading is allowed.
The important question is how much of the table's structure needs to be recovered. A long table can still have a simple layout. A small table can be difficult if a heading spans several columns or a tiny symbol belongs beside a number.
The examples below show a clear financial screenshot handled locally, followed by a more complex table with results from both Local Image to Table and AI Image to Table. The visible differences show where local recognition struggles and why AI is the better choice for the second example.
Case 1: A clear financial screenshot works well locally
Suppose you need to move these quarterly financial figures into Excel. The source has no vertical grid lines, but the labels and numbers line up clearly:
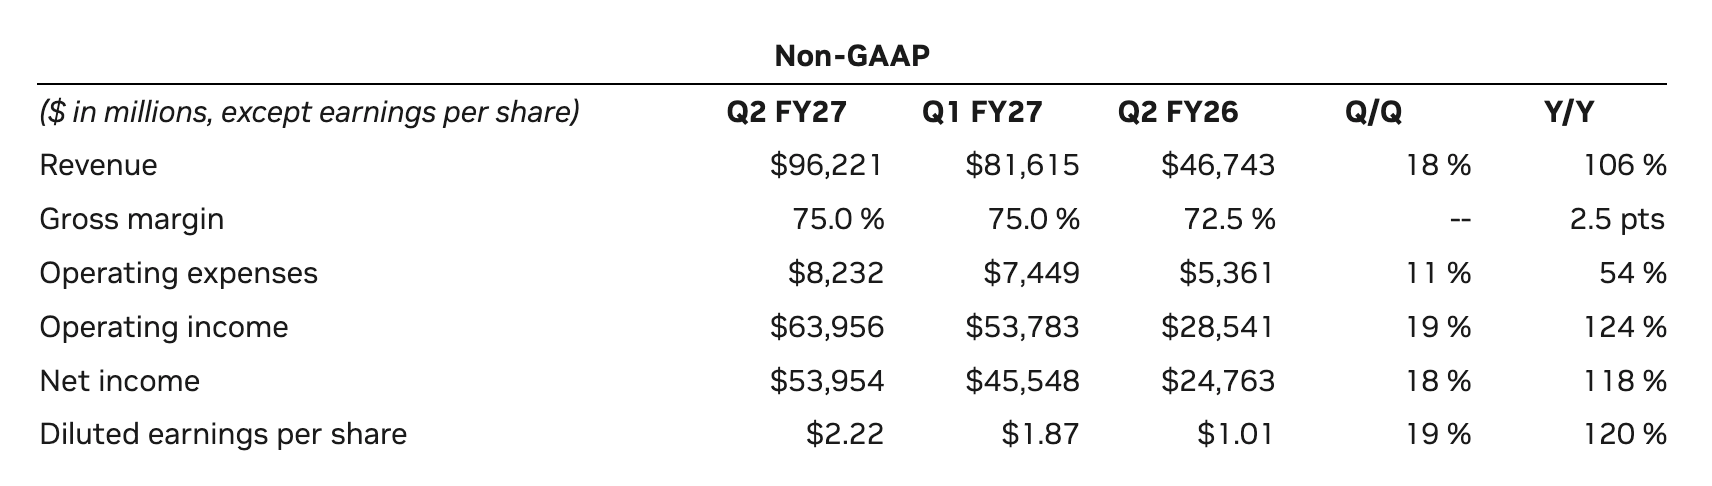
There are six data rows. Each row follows the same pattern: a metric, three quarterly values, and two change values. The title spans the table, but the data beneath it is regular.
Here is the saved result from Local Image to Table:
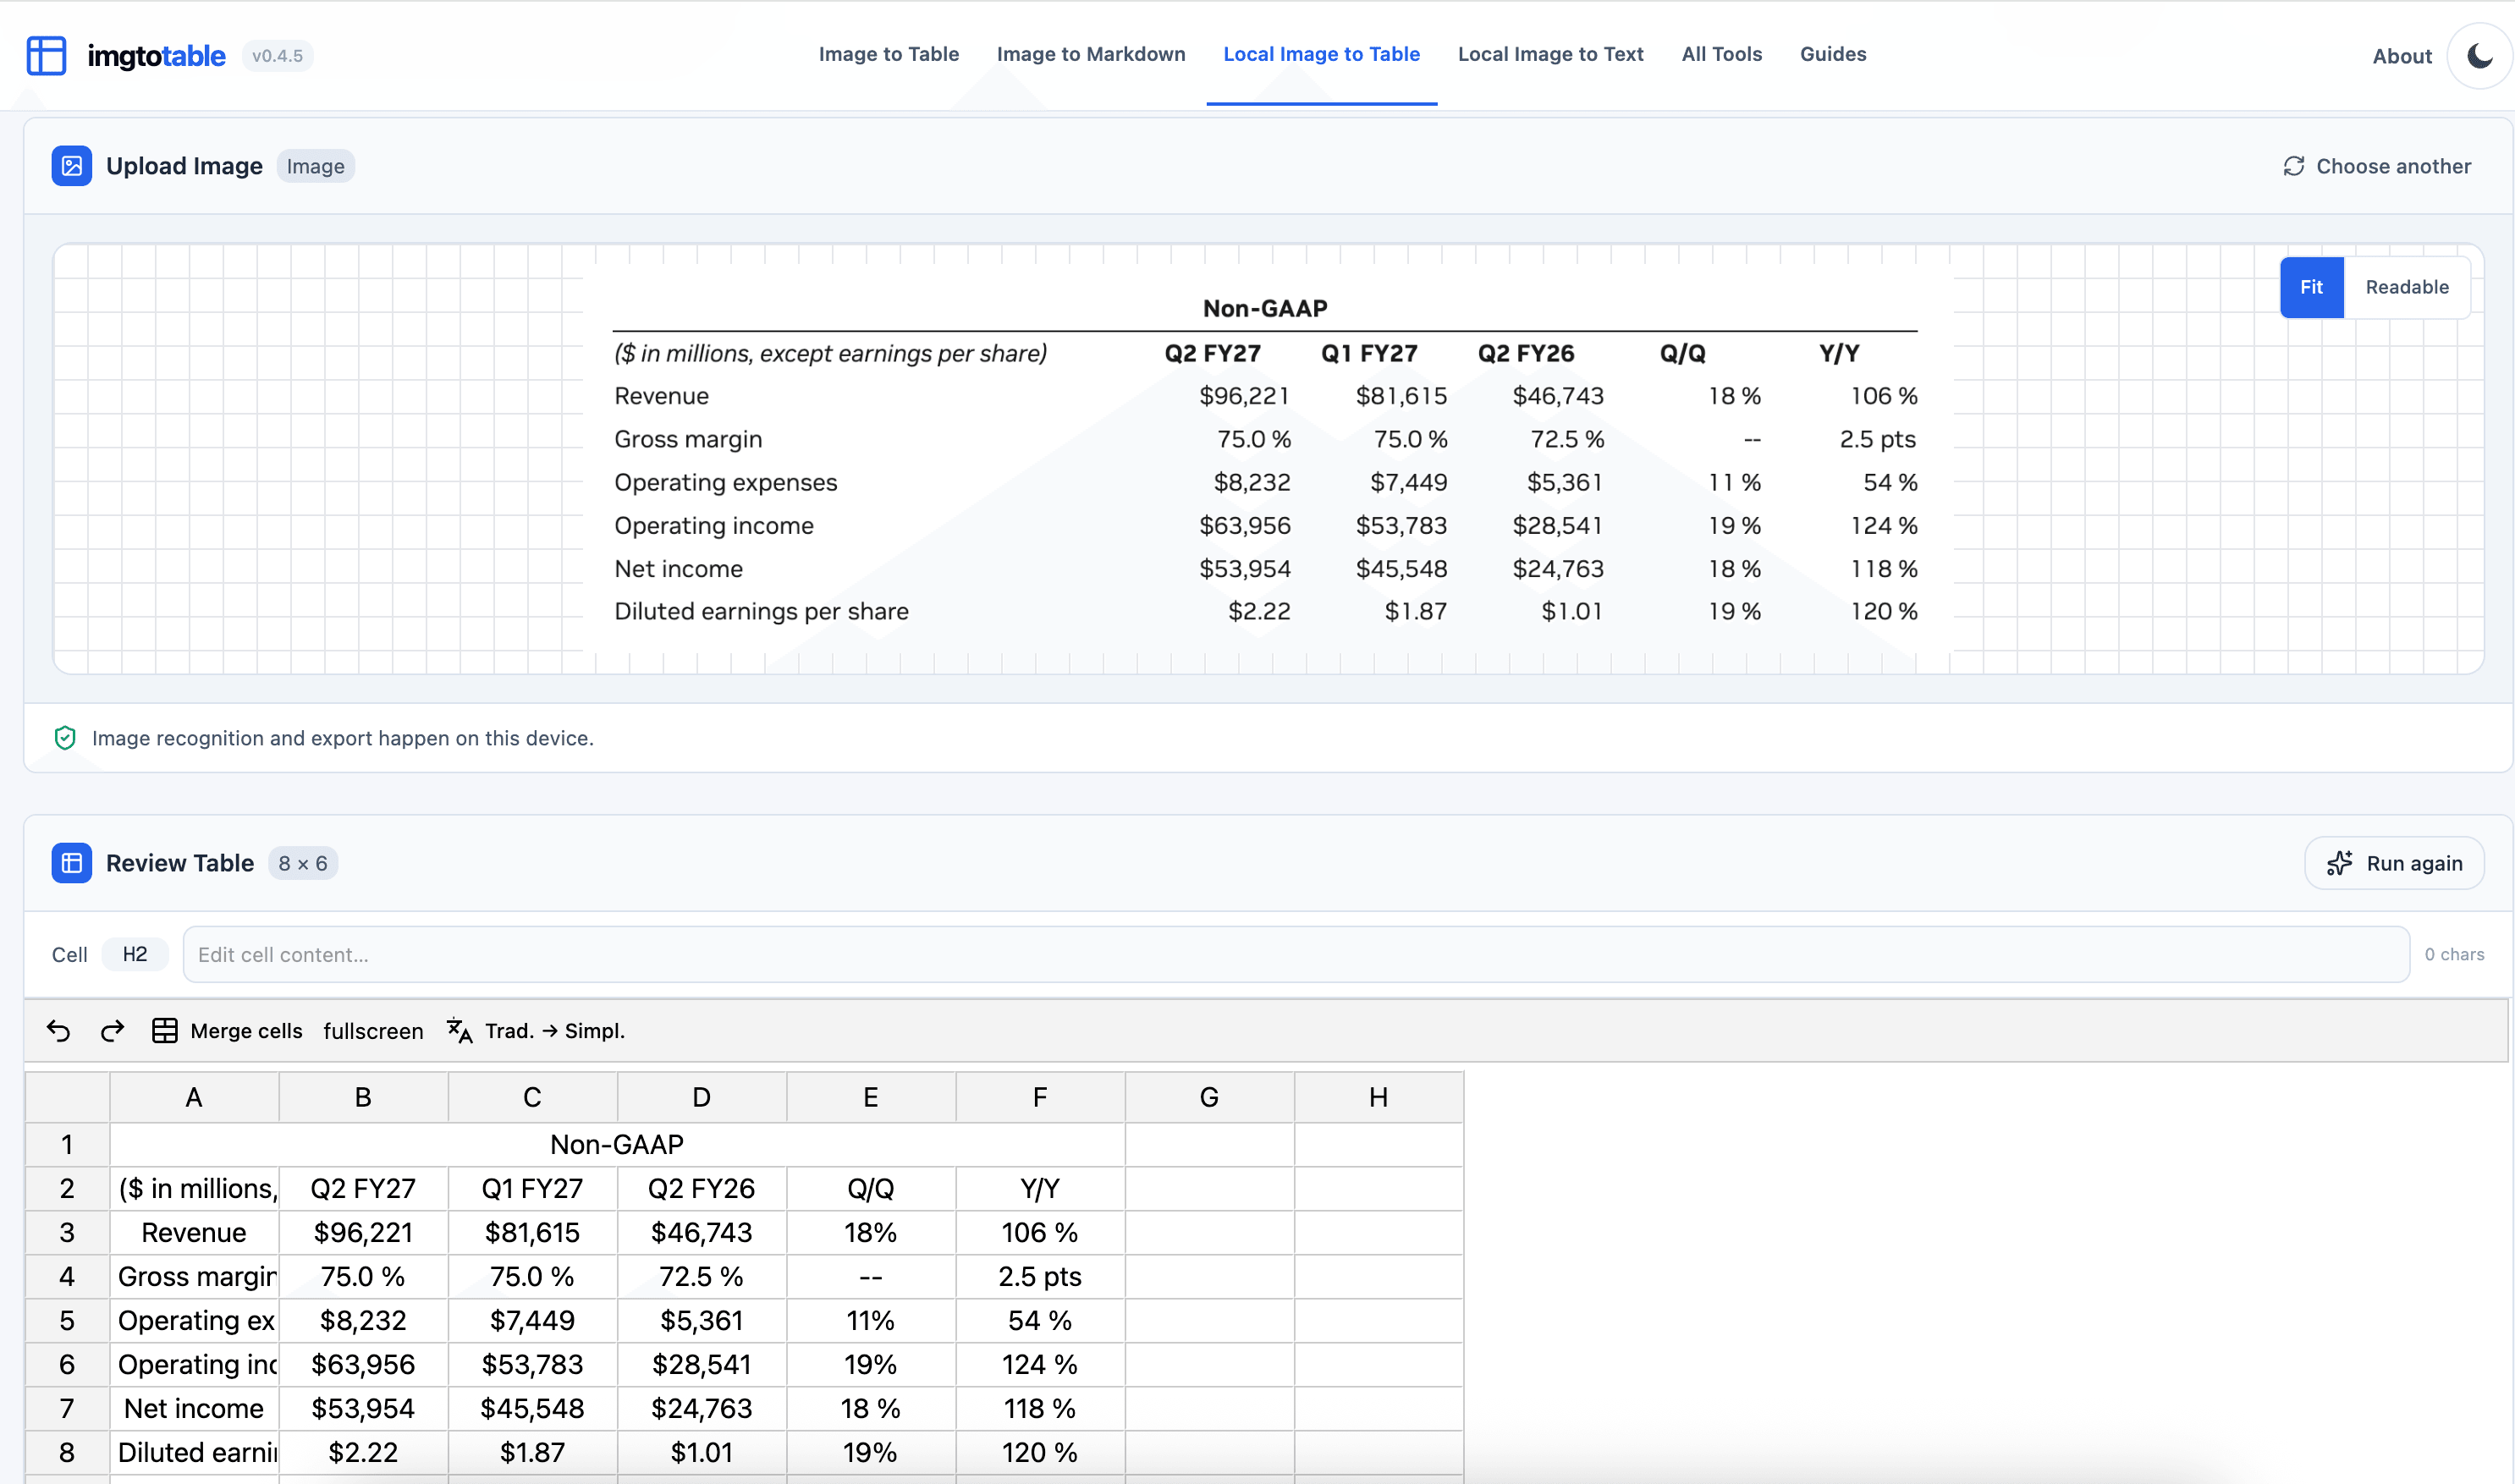
The visible revenue row retains $96,221, $81,615, and $46,743 under their matching quarters. In the gross-margin row, -- remains in Q/Q and 2.5 pts remains in Y/Y. Those details matter: a placeholder should not become zero, and a percentage-point change should not lose its unit.
What to choose: Local Image to Table is a reasonable first choice for this kind of readable, consistently aligned screenshot. Missing vertical lines alone are not a reason to switch tools. Check the values and headers, then export the reviewed table. The local extraction walkthrough covers this workflow.
Case 2: Local recognition struggles with a complex borderless table
This financial table is readable, but its layout is harder to reconstruct. It has no vertical borders, some headers wrap onto two lines, and dollar signs sit apart from their values. The label “Data center leases not commenced” also spans two lines within a single data row.
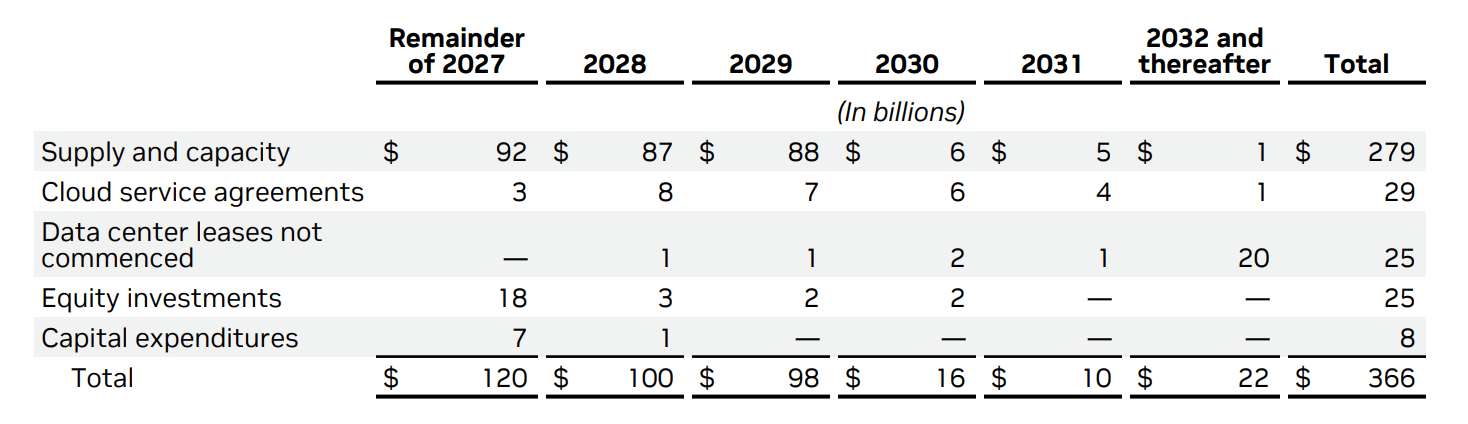
Local Image to Table produces a poor result on this example. It recognizes much of the text, but fails to preserve the relationships between headers, rows, and values:
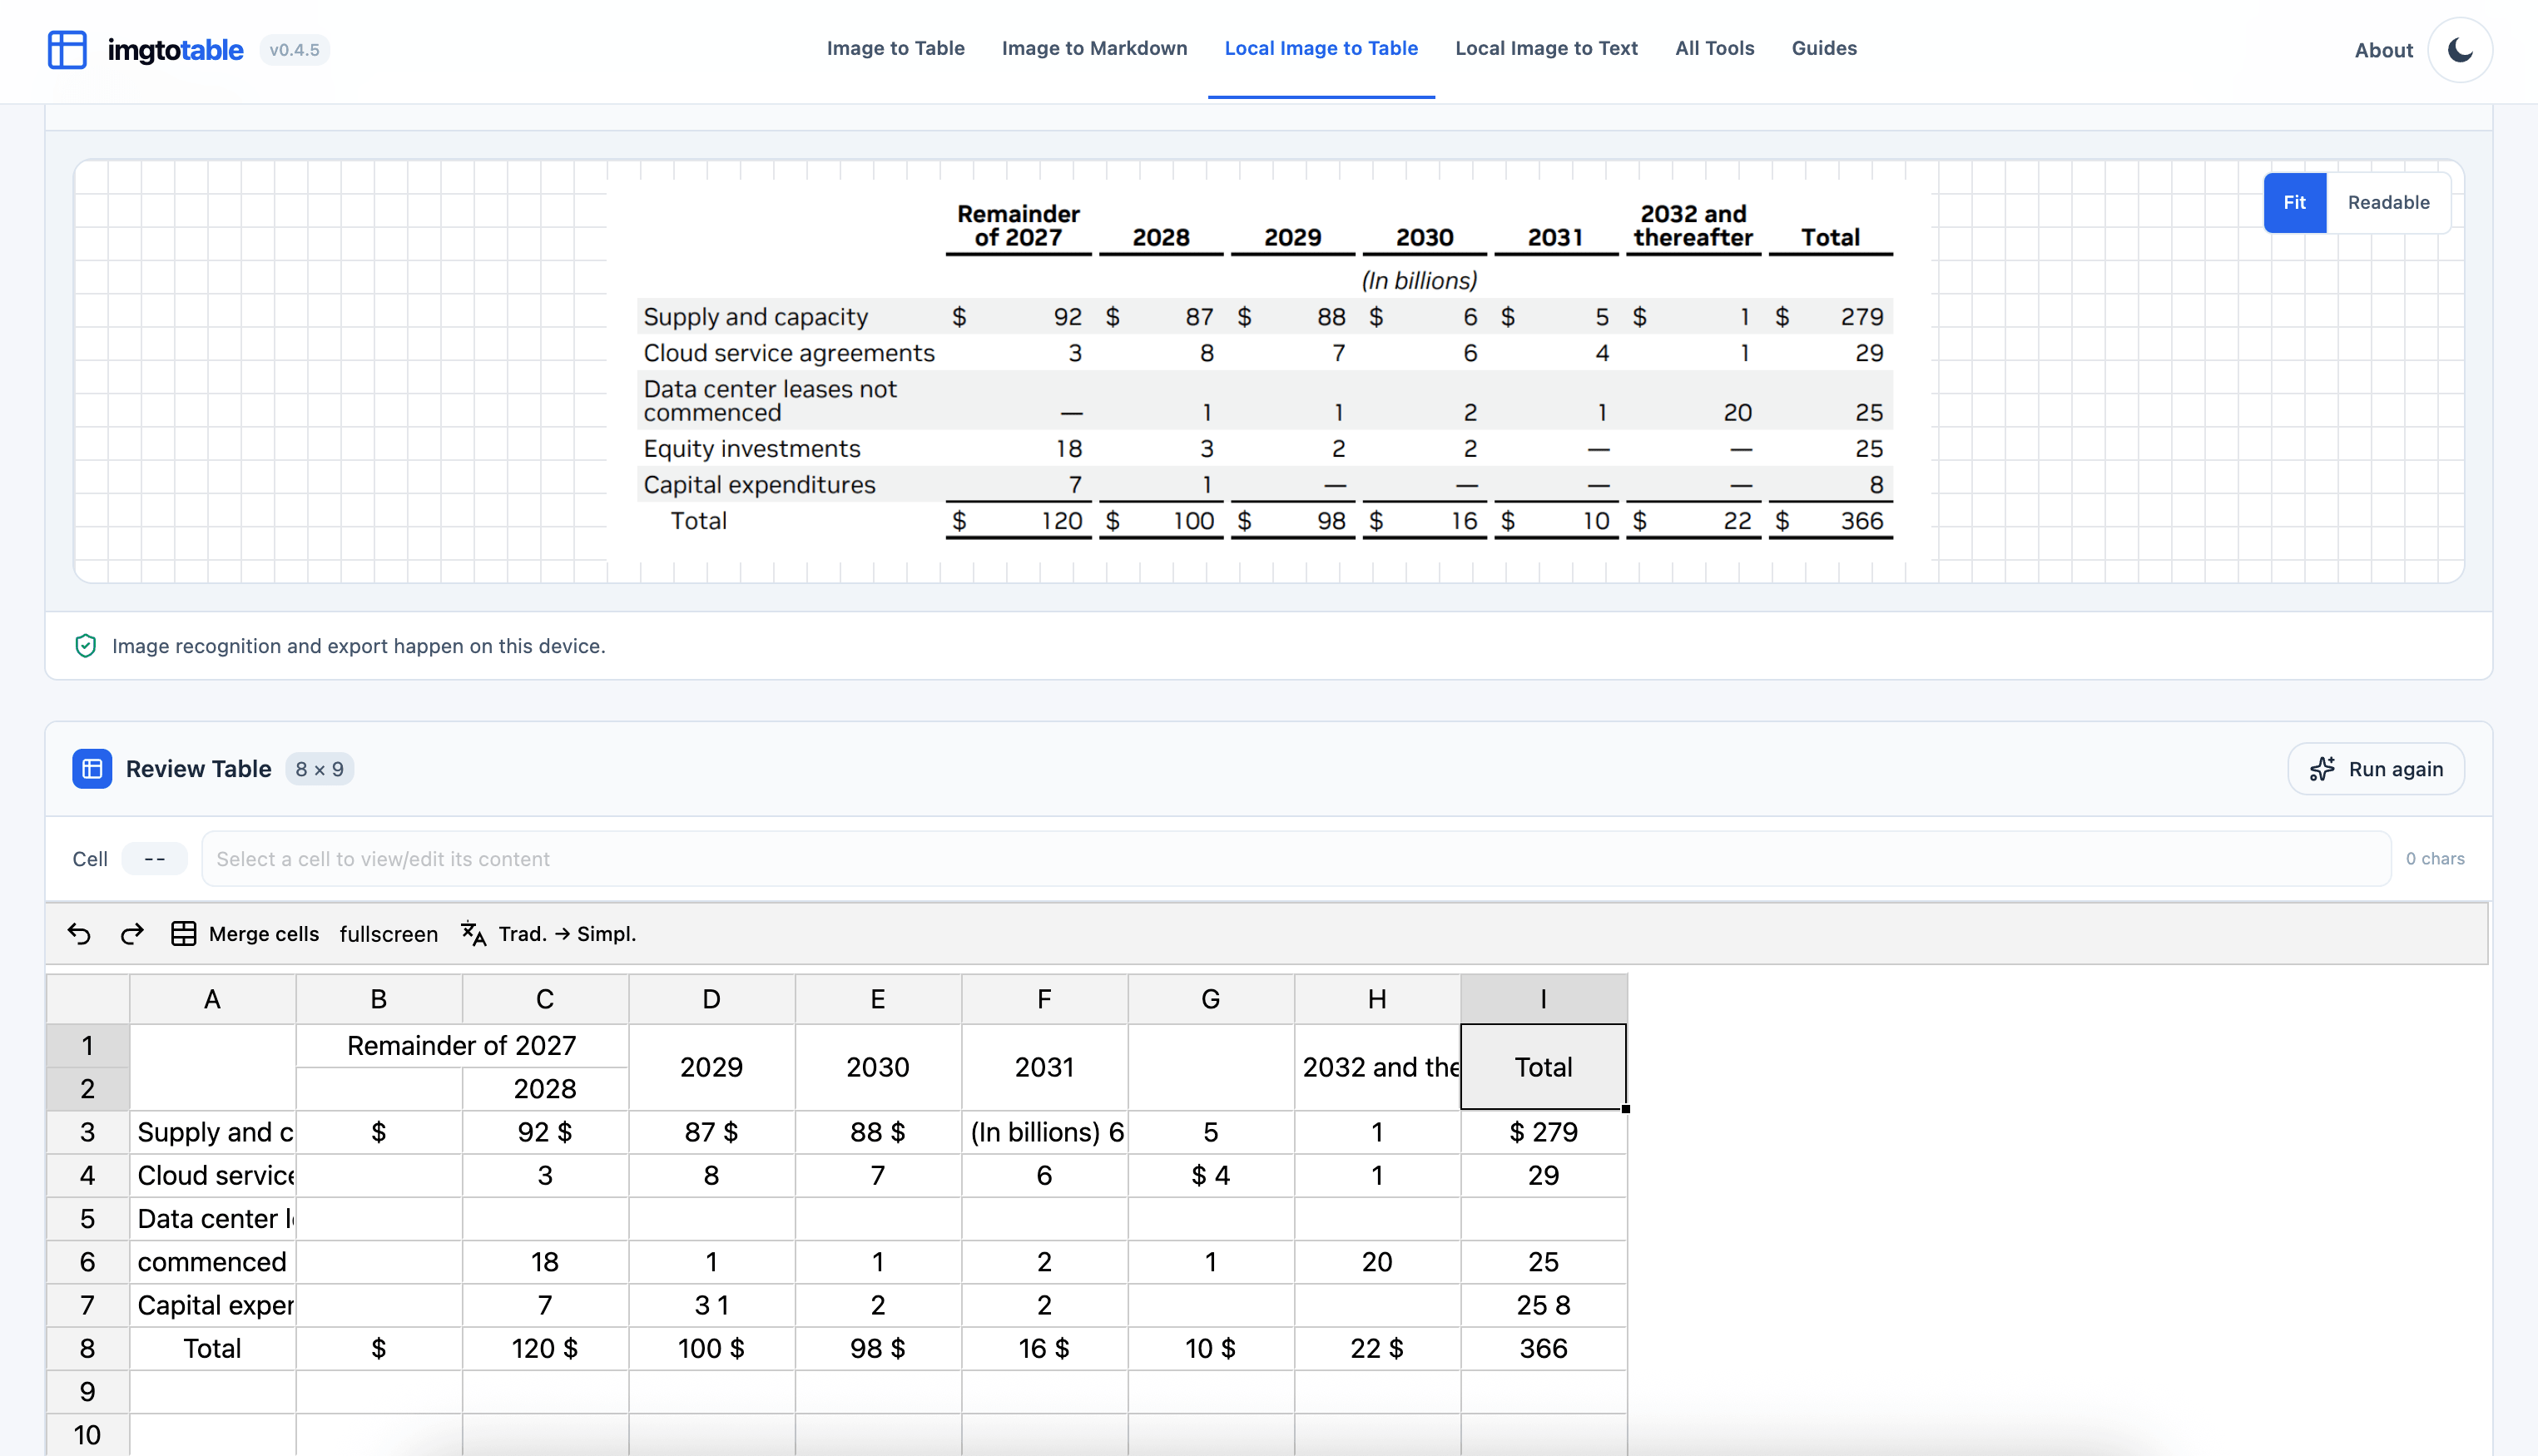
- The year headers are misaligned. “2028” appears beneath “Remainder of 2027,” and the values no longer line up with their correct years.
- A wrapped label becomes separate rows. “Data center leases not commenced” is split, disrupting the rows below it. “Equity investments” no longer appears as a separate labeled row.
- Text and numbers are mixed together. “(In billions)” is attached to the value
6, and the last cell in the capital-expenditures row contains25 8instead of the single value8.
These errors require rebuilding parts of the table, rather than correcting a few characters. For a complex layout like this, use AI Image to Table.
The AI result below preserves the structure much more successfully:
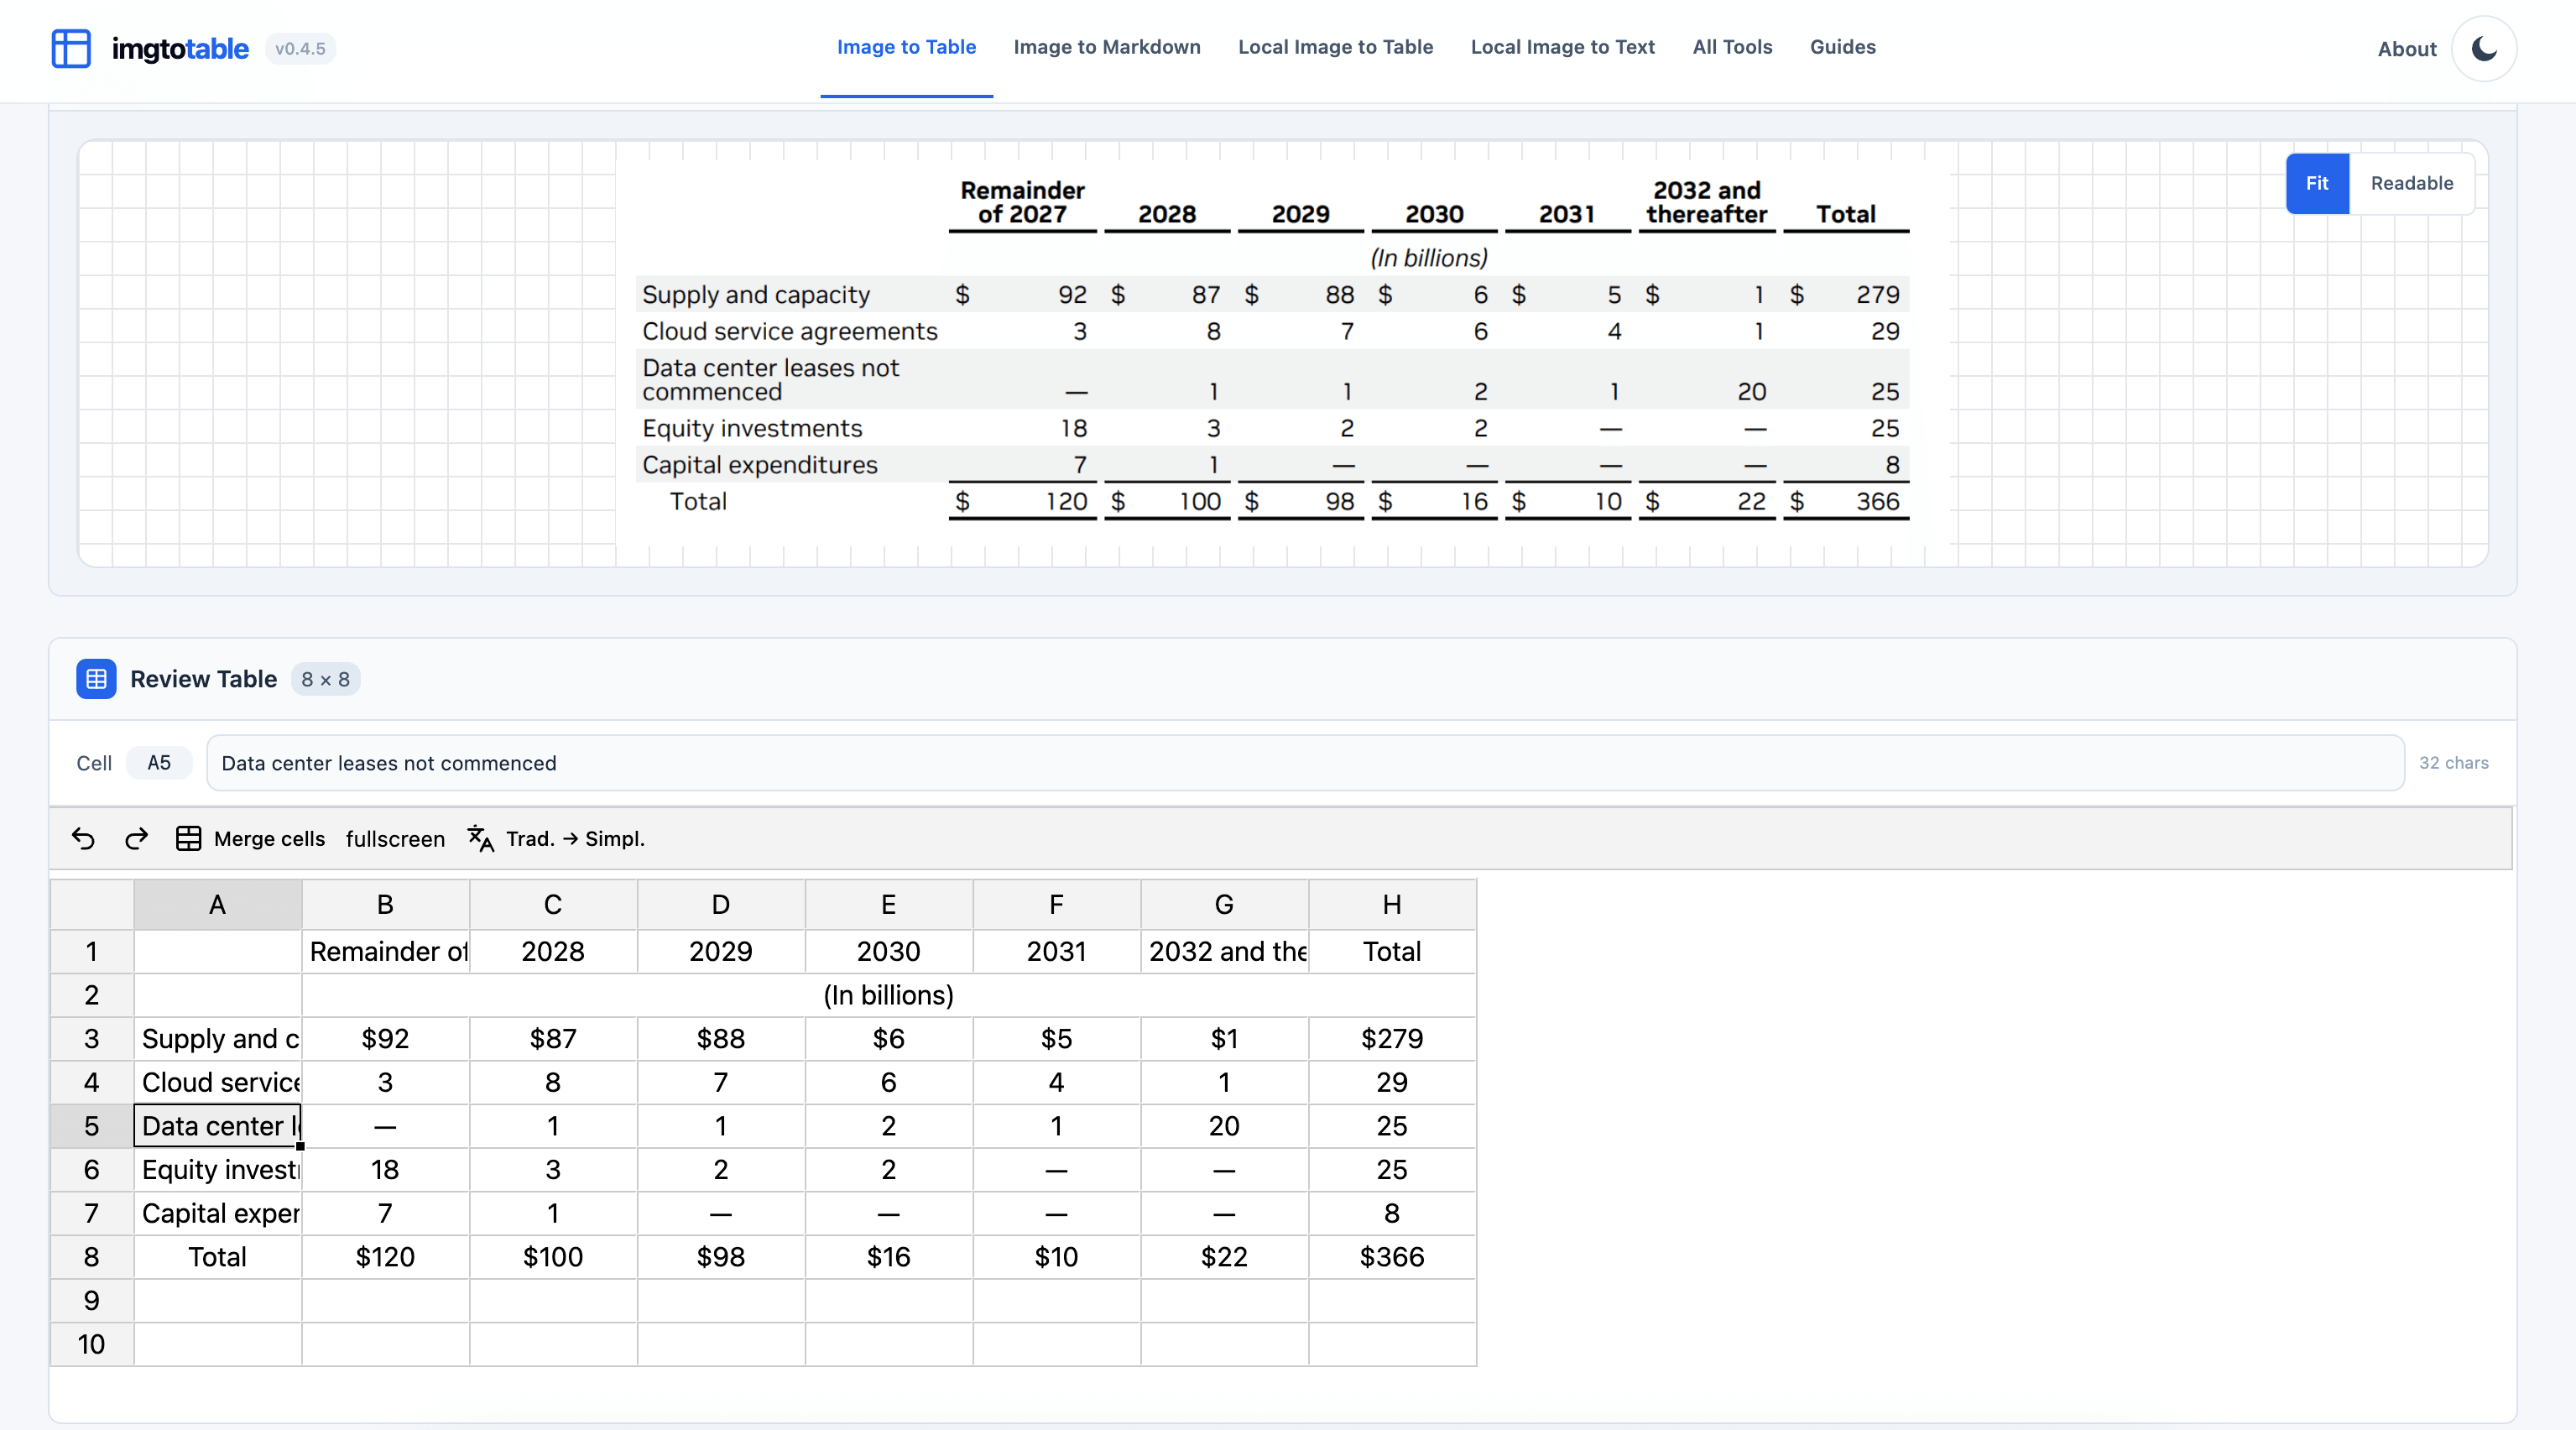
The year headings occupy one header row, “(In billions)” stays in a separate merged row, and the data-center lease and equity-investment entries remain distinct. The totals also line up under their corresponding years, ending with $366 in the Total column.
What to choose: Local Image to Table works well for the regular screenshot in Case 1, but handles this more complex table poorly. For borderless tables with wrapped labels, irregular spacing, and merged headings, start with AI Image to Table when uploading is allowed, then verify the extracted values before exporting.
Why choose AI Image to Table for complex layouts?
Consider the editing work created by a misplaced heading. If one value is wrong, you can correct one cell. If a heading that should span four columns is split incorrectly, you may need to rebuild the header and check every row beneath it.
AI Image to Table sends the image to a server-side model that generates a table representation, including merged-cell spans. The browser rebuilds that output as an editable grid. This makes it a practical first option when reconstructing the layout is the main challenge.
Choose it first for tables with features such as:
- Multi-level headers: a year or department heading spans several subcolumns.
- Merged cells across rows: one category label applies to several separate records.
- Wrapped cell text: a description occupies multiple lines within a single row.
- Uneven spacing and blank cells: values must retain their positions despite gaps in the layout.
The second example shows a clear structural advantage for AI on that image. Results will vary with the source, and AI output still needs review, especially for omitted rows, incorrect merges, and small numeric signs.